Small businesses are the lifeblood of any economy. Mom-and-pop restaurants, corner stores, family-owned shops, boutique tech firms, and other ventures drive economic growth, foster innovation, and generate employment opportunities.
These businesses are the beating heart of the community. They provide essential services and goods, adding a unique flavor to local markets.
2023 continues to illustrate the importance of small businesses as they navigate through challenges and seize new opportunities.
In this article, we delve into the nitty-gritty of small business statistics for 2023 and provide insights into their triumphs, tribulations, and trends.

General Small Business Statistics
Small Business Owner Statistics
Industry-Wise Small Business Statistics
Financial Small Business Statistics
Jobs in Small Businesses Statistics
Small Business Marketing Statistics
Small Business Technology Statistics
Small Business Challenges Statistics
General Small Business Statistics
- Most businesses are small — 99.9% of American businesses. (SBA, 2023)
- Small businesses pay 39.4% of the private sector payroll. (SBA, 2023)
- There are 33 million small businesses in the United States. (SBA, 2023)
- From 1995 to 2021, small businesses created 17.3 million net new jobs, accounting for 62.7% of net jobs created since 1995. (SBA, 2023)
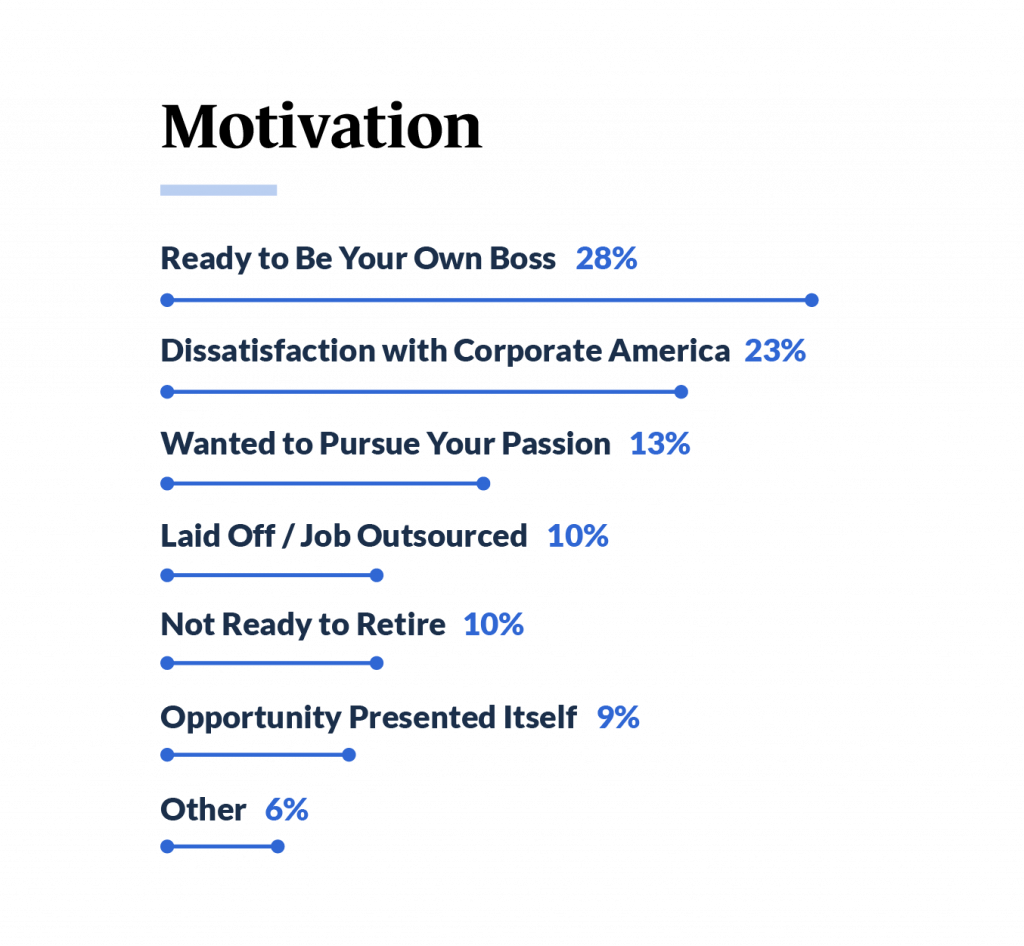
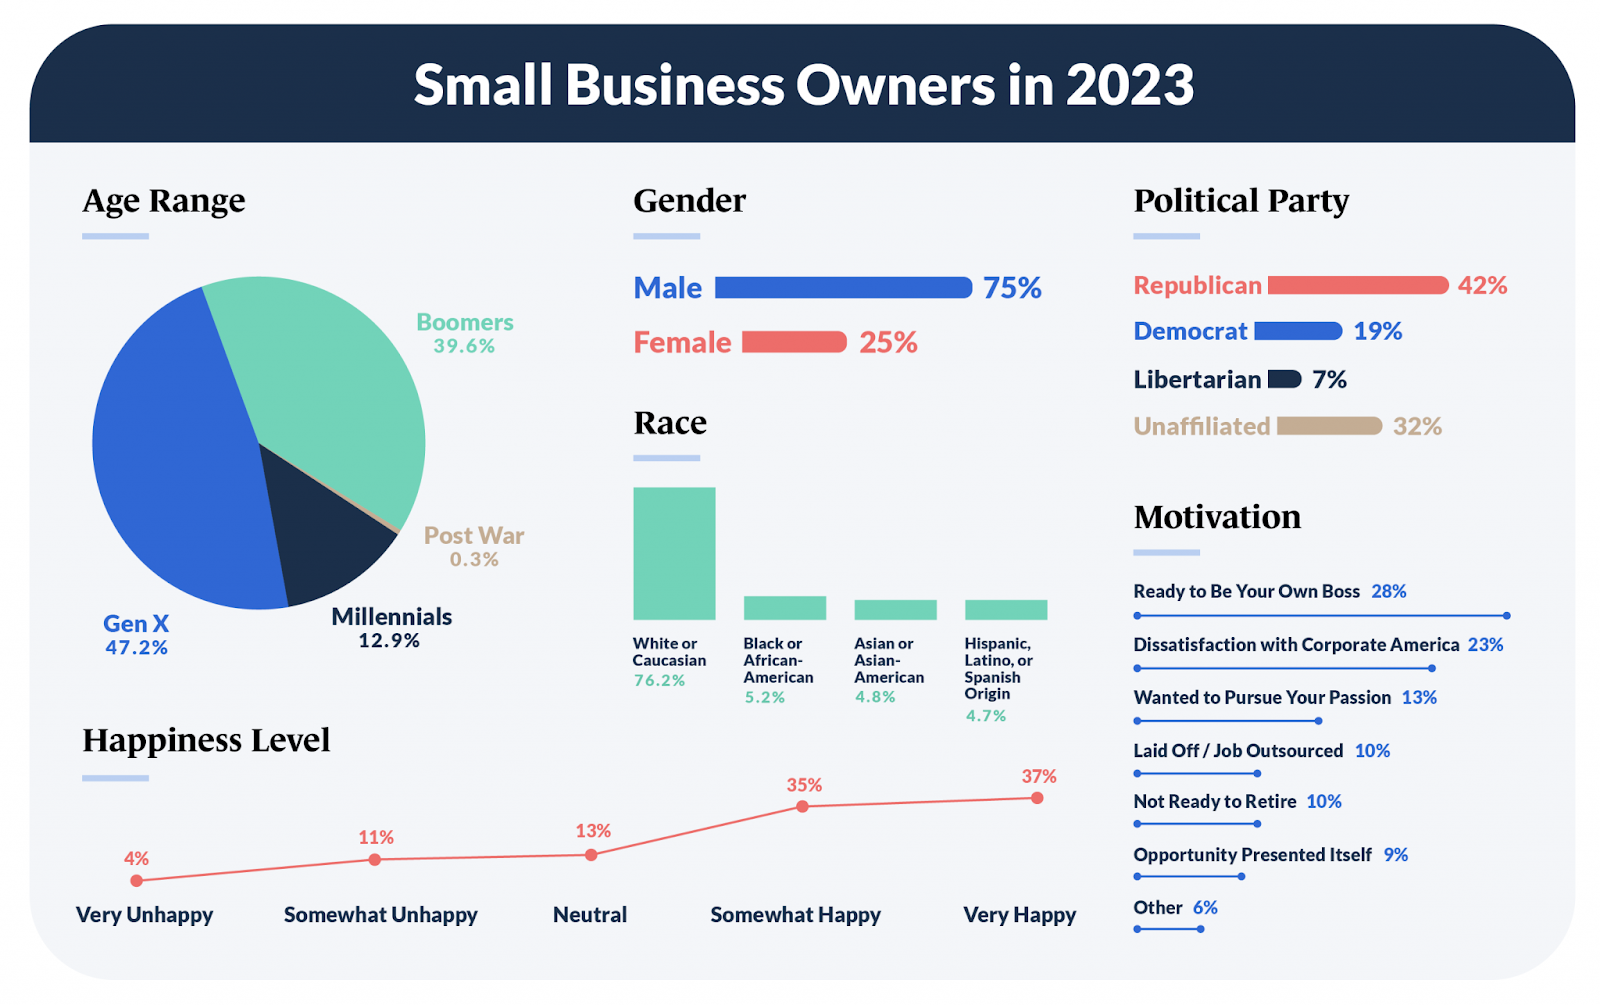
- Business owners primarily go into business because they are “ready to be their own boss” (28%) and overall dissatisfaction with corporate America (23%). (Guidant Financial, 2023)
- Small businesses generate 32.6% of known export value. (SBA, 2023)
- Small businesses employ 61.7 million Americans, which equals 46.4% of private sector employees. (SBA, 2023)
- About 38% of small businesses use specialized software in their business operations. (SBA, 2023)
Small Business Owner Statistics
- Baby Boomers (39.63%) and Gen X (47.20%) make up the majority of small business owners. (Guidant Financial, 2023)
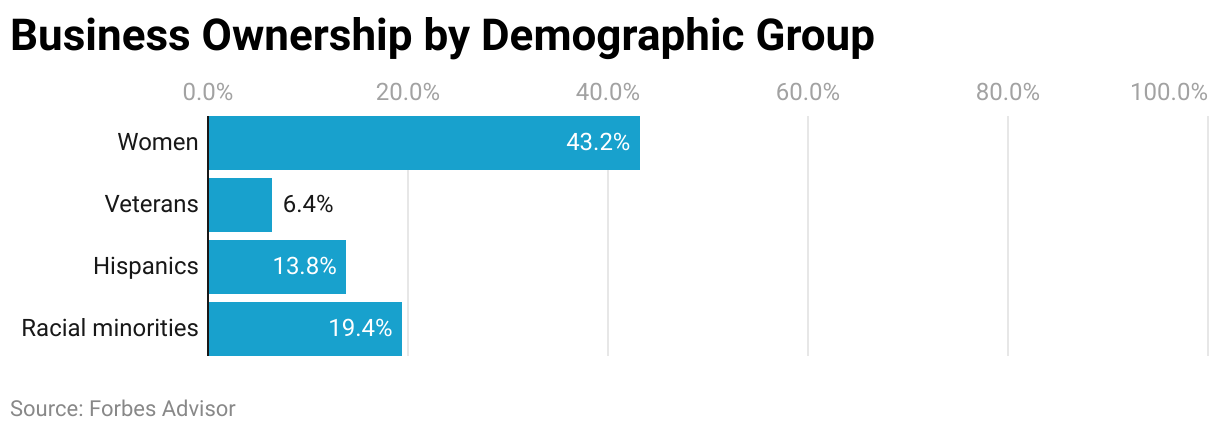
- Females only own 43.2% of small businesses. Racial minorities own 19.4% of small businesses. (Forbes, 2023)
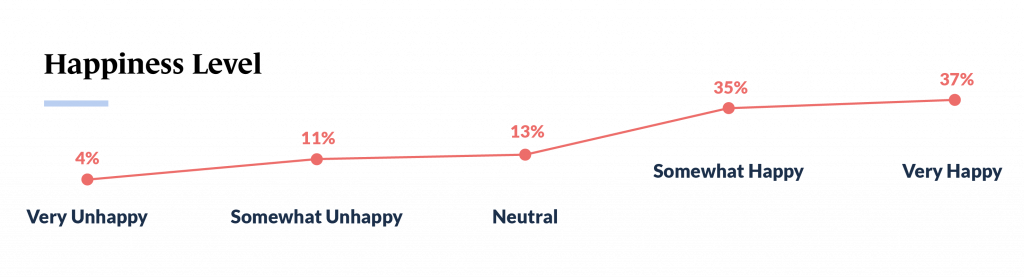
- Over 70% of small business owners feel satisfied as business owners, with 37% feeling “very happy” and 35% feeling “somewhat happy.” (Guidant Financial, 2023)
Industry-Wise Small Business Statistics
- The fastest-growing industries are healthcare and social assistance. (Forbes, 2023)
- The largest decrease in closures was observed in the transportation and storage sector, where the rate of closure fell by 8% from 21% to 13% in 2022, pointing to a progression toward business as usual or at least a new normal. (Meta, 2022)
- Of small and midsize businesses (SMBs) in the hotels, cafes, and restaurants sector, 35% reported increasing their number of workers. (Meta, 2022)
- Respondents in more traditional face-to-face industries like food & beverage, restaurant & bar, and retail are more worried than those in other industries about maintaining inventory/fulfillment, bouncing back to pre-COVID business levels with a more cost-conscious public and cash flow disruptions. (Verizon, 2022)
Financial Small Business Statistics
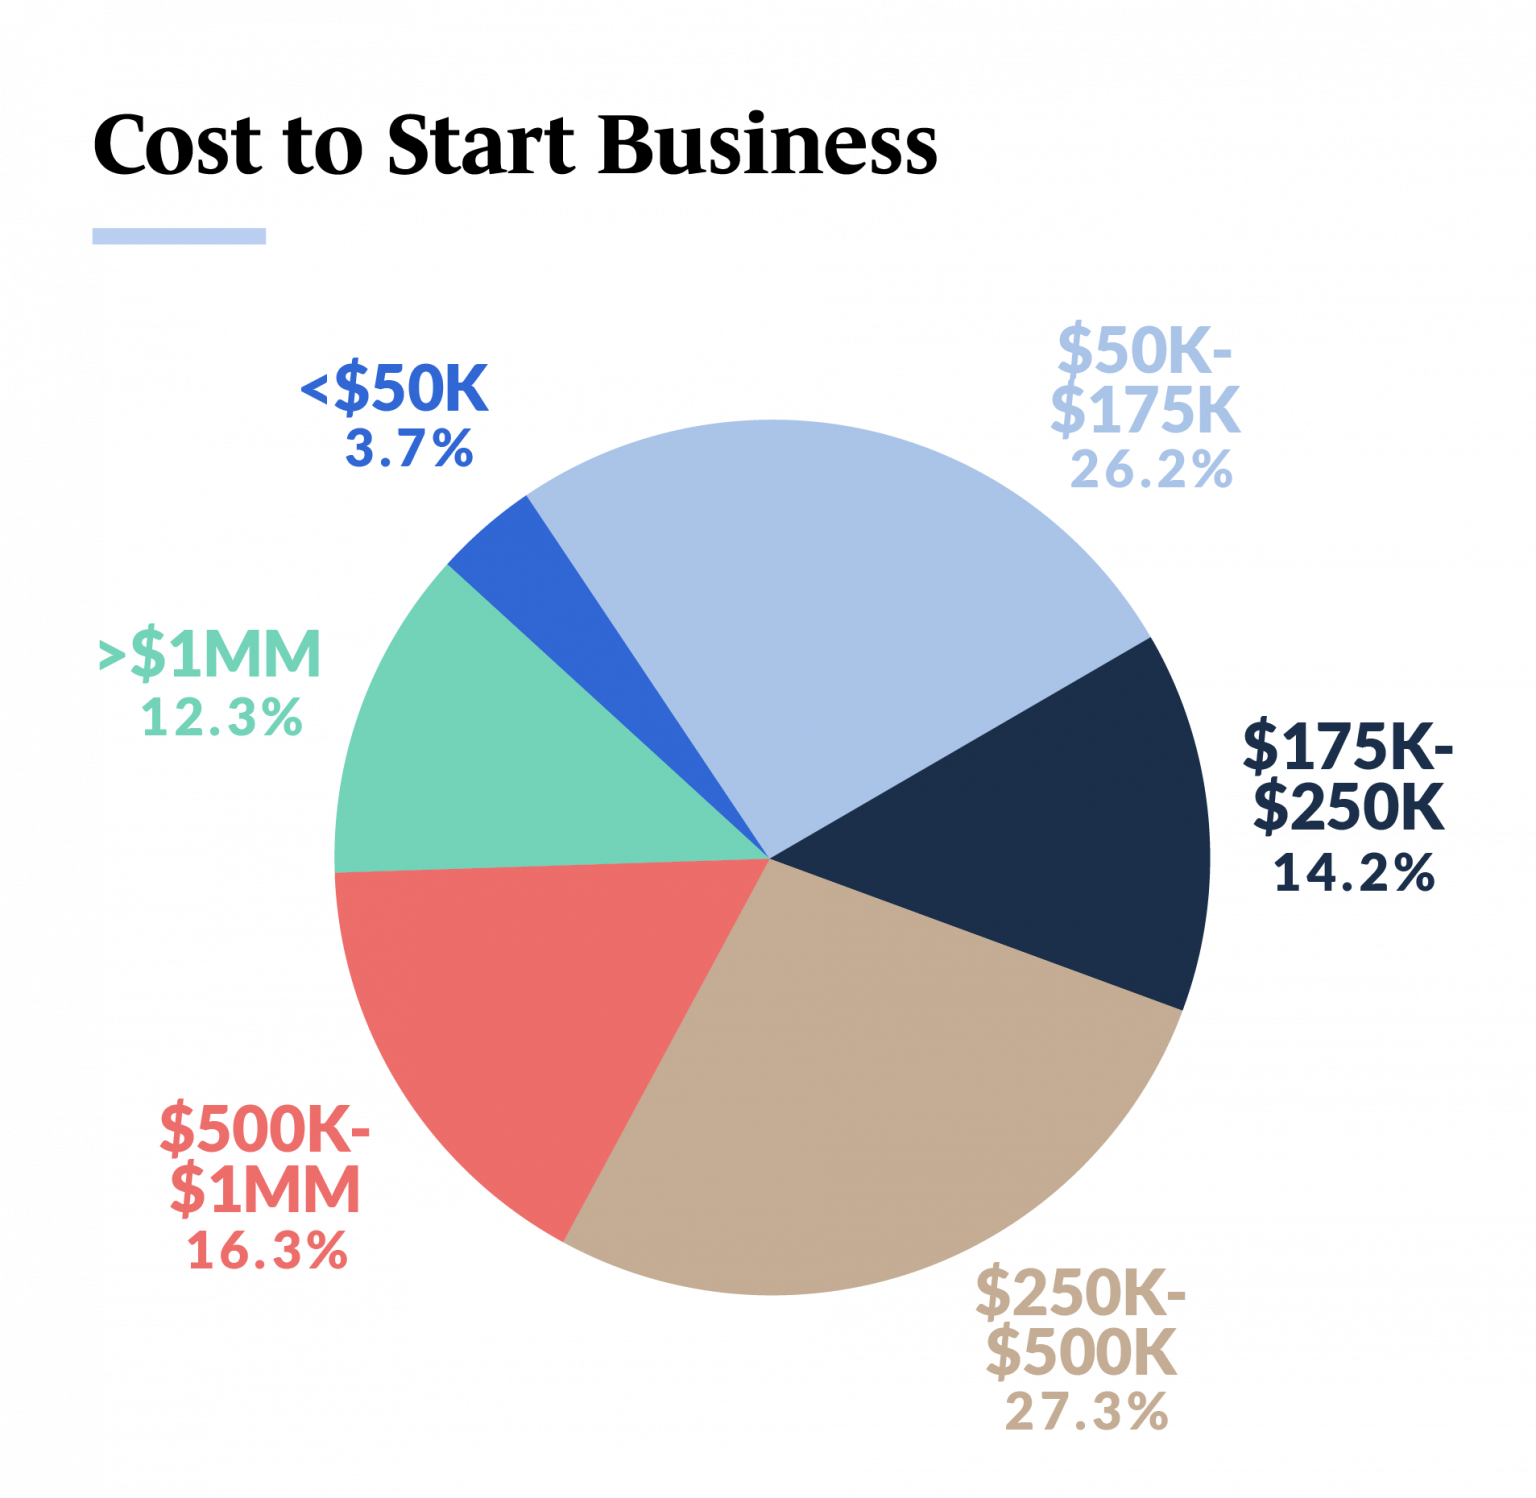
- Startup costs for most small businesses are between $250k to $500k (27.3%). The second-highest reported startup costs are between $500k to $1 million (16%). (Guidant Financial, 2023)
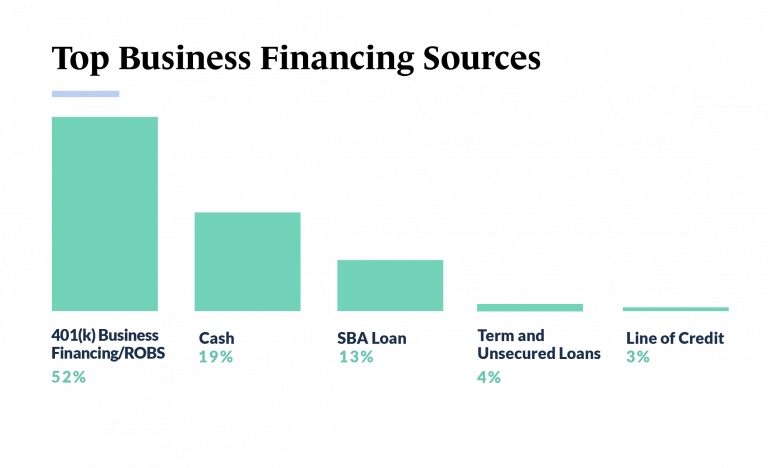
- Almost half of small business owners use 401(k) business financing to start their ventures. Others also use cash, SBA loans, lines of credit, and term and unsecured loans. (Guidant Financial, 2023)
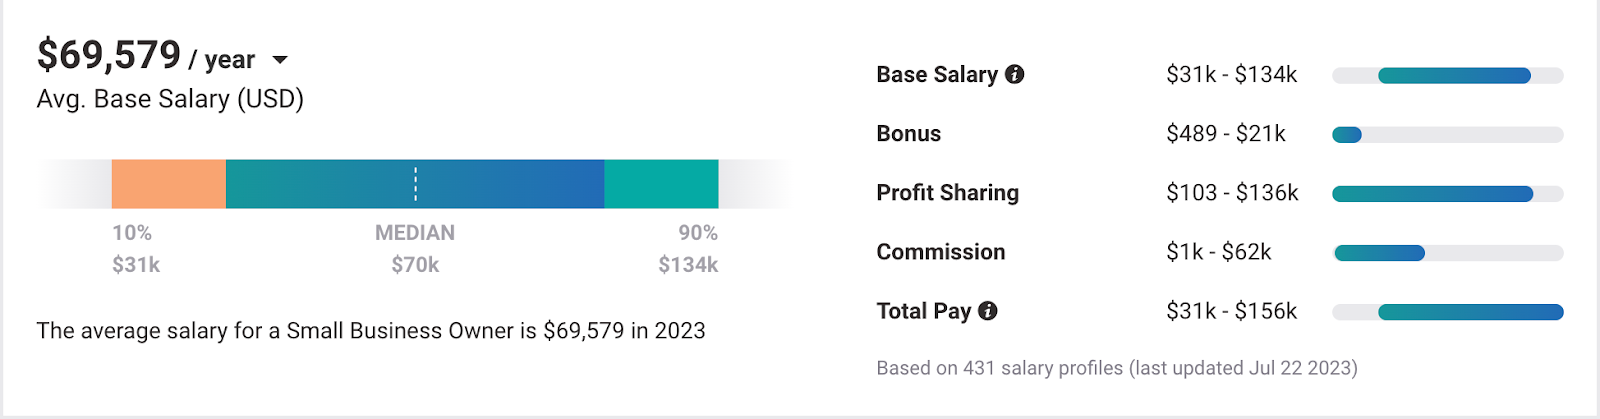
- The average small business owner’s salary is $69,579 per year. (Payscale, 2023)
- Of SMBs globally, 24% reported increasing their prices by 20% or more in the first half of 2022. (Meta, 2022)
- Of SMBs reporting increases, those that reported at least a 10% increase in price were also likely to report an increase in costs of at least 10%. (Meta, 2022)
Jobs in Small Businesses Statistics
- Small businesses have added over 12.9 million jobs in the last 25 years. (Forbes, 2023)
- The industry with the most job openings is the education and health services industry. (Forbes, 2023)
- Approximately 20% of women-led SMBs reported increasing their number of employees in the first half of 2022, and 13% reported decreasing their number of employees, compared to 25% and 17% of men-led SMBs, respectively. (Meta, 2022)
- Over 80% of US SMBs reported their workforce either increased or remained the same in the first half of 2022. (Meta, 2022)
- US minority-led SMBs were more likely to report increasing their number of workers (20%) than other SMBs (16%). (Meta, 2022)
Small Business Marketing Statistics
- Of small businesses in the US, 55% were advertising on social media in 2021. (Meta, 2022)
- Of those small businesses advertising on social media, 66% used Facebook, while 42% used YouTube. (Meta, 2022)
- Of all small businesses, 28% don’t have a website. (Top Design, 2021)
- Almost half of small businesses (46%) have in-house employees managing their websites, and 32% use DIY website builder software. (Top Design, 2021)
Small Business Technology Statistics
- Women-led SMBs reported higher proportions of sales made digitally than men-led SMBs at a global level. (Meta, 2022)
- Women-led SMBs used digital tools accordingly for marketing-led purposes (advertising, communicating directly with customers, and selling goods and services) more often than men-led SMBs. (Meta, 2022)
- Nearly two-thirds of SMBs (63%) on the Facebook app generated some proportion of their sales in the past 30 days through digital channels. (Meta, 2022)
- Sub-Saharan Africa stands out as the region where the highest proportion of SMBs reported digital sales of over 50% (32%). (Meta, 2022)
- Over a third of U.S. Black-led SMBs reported that over half of their sales were made digitally (39% of respondents), leading all minority groups. (Meta, 2022)
- Most respondents say their business has added or upgraded its internet connection to a high-speed or high-capacity plan in the past year. (Verizon, 2022)
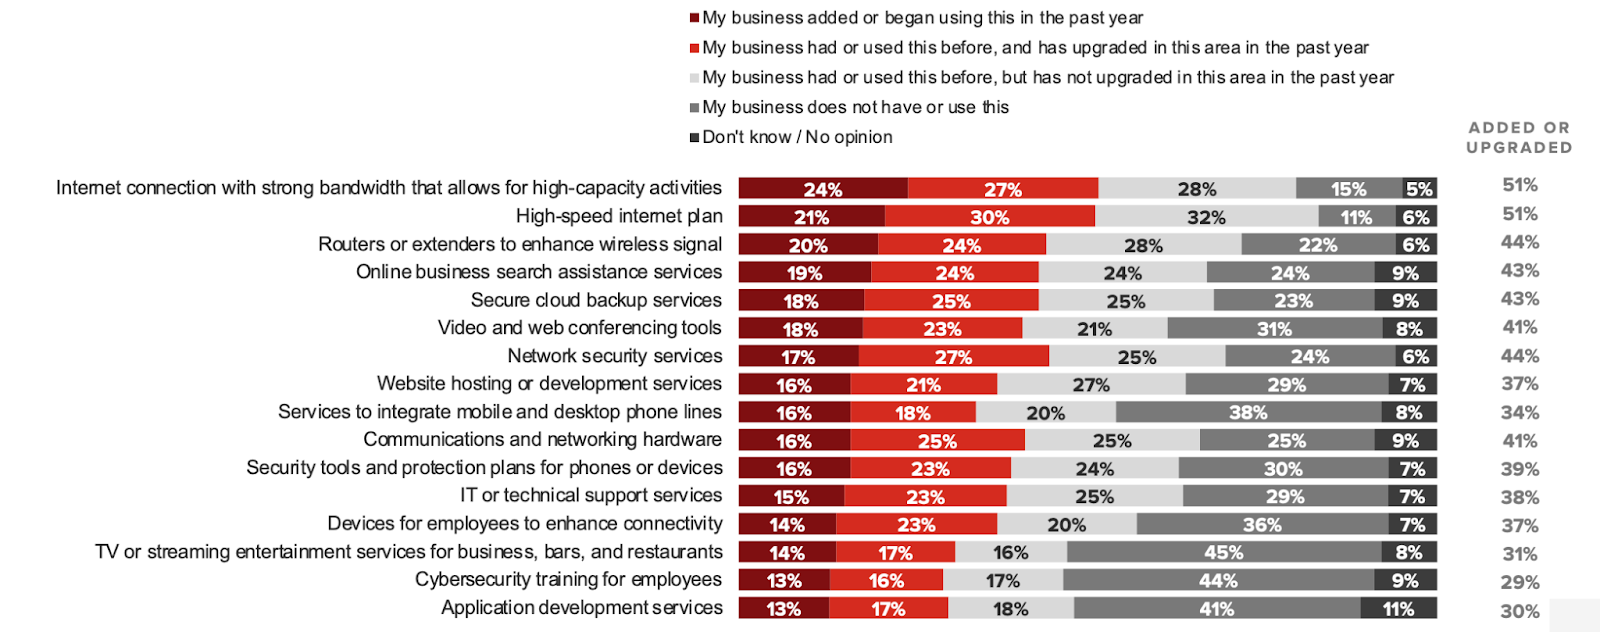
- 44% have added or upgraded network security services, and 29% have invested in employee cybersecurity training. (Verizon, 2022)
- Respondents most commonly say their business has added connectivity technology in the past year to streamline operations (78%). About half say they added technologies to connect with existing customers (53%) or acquire new ones (48%). (Verizon, 2022)
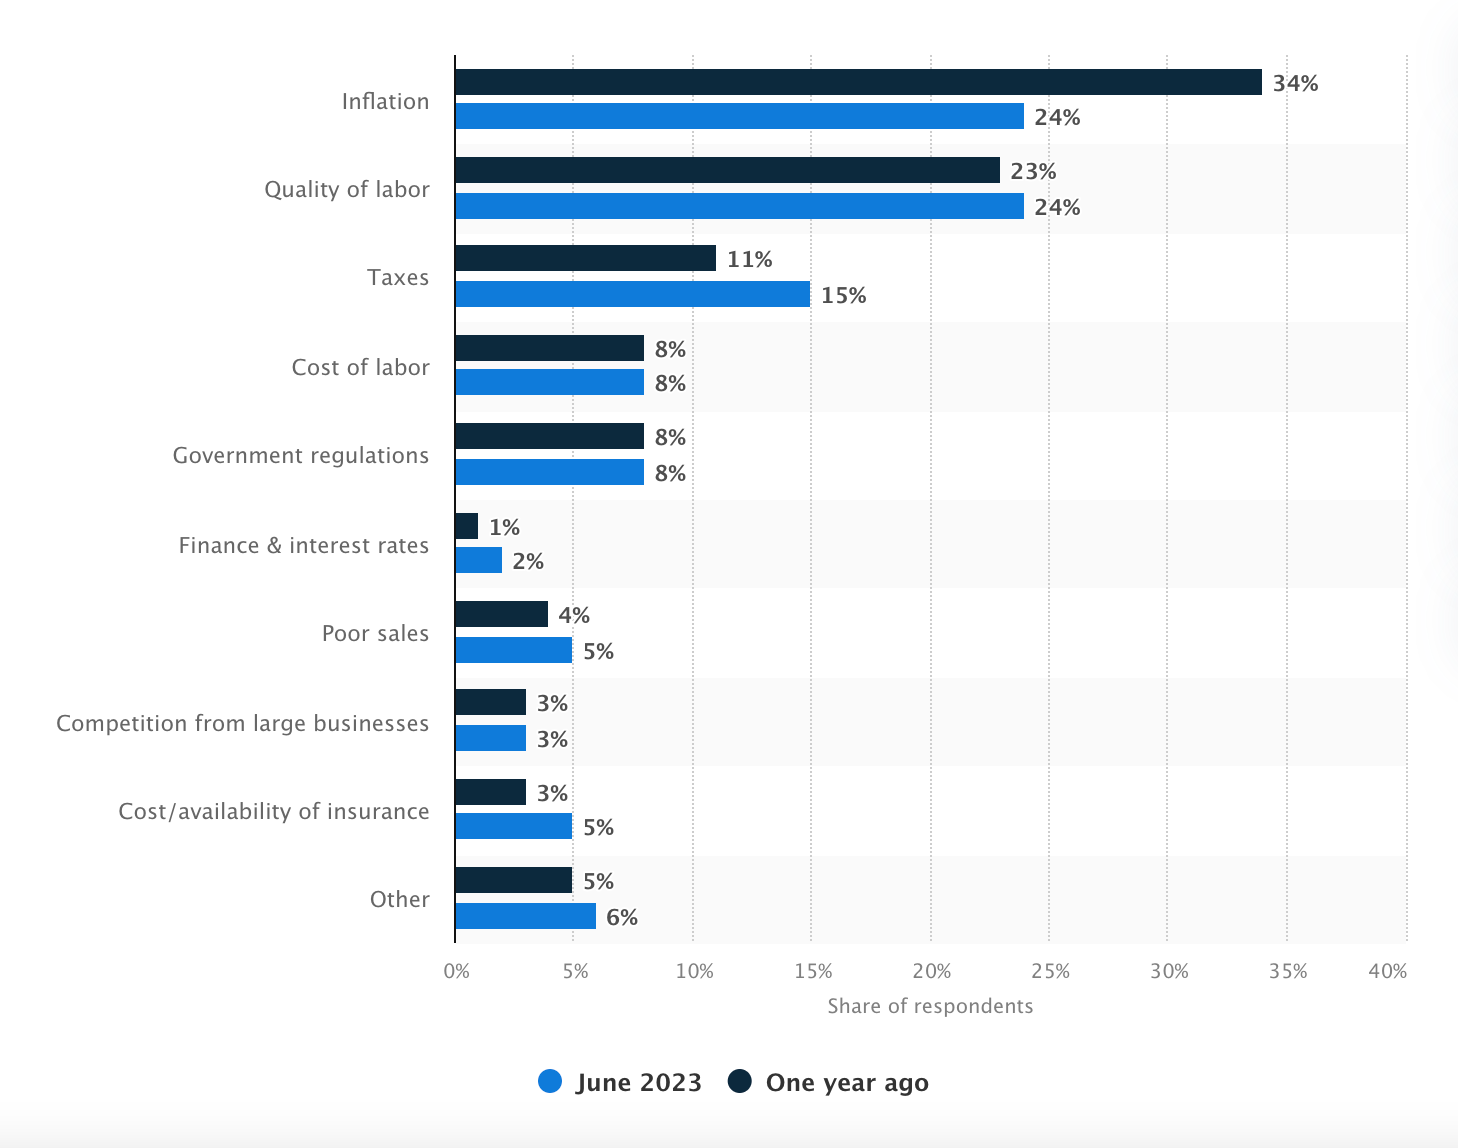
Small Business Challenges Statistics
- Inflation and quality of labor are the most important problems for small businesses in the United States. (Statista, 2023)
- Women-led SMBs reported higher proportions of business closures at 23%, versus 17% of men-led SMBs. (Meta, 2022)
- Despite higher closure rates, women-led SMBs reported better sales performance compared to men-led SMBs. Approximately 33% of women-led SMBs reported decreasing sales in the past 30 days, relative to 39% of men-led SMBs. (Meta, 2022)
- In the US, 20% of SMBs reported that they were closed in October 2022. (Meta, 2022)
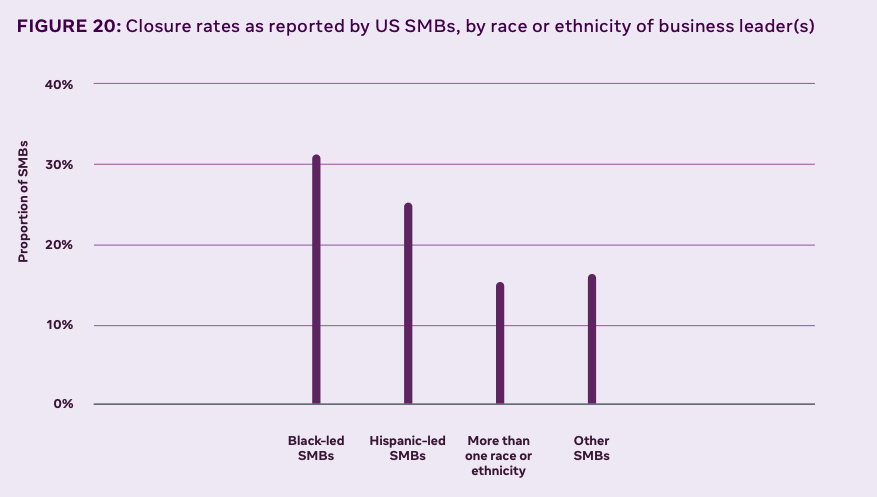
- US minority-led SMBs were 8% more likely to report closure than other SMBs. (Meta, 2022)
- 31% of US Black-led SMBs reported being closed. (Meta, 2022)
- Nearly 9 in 10 respondents (89%) say they’re concerned about the state of the US economy, and more than 4 in 5 say they’re concerned about small businesses in the US and the global economy. (Verizon, 2022)
- Nearly 4 in 5 respondents (78%) say their business has experienced increased costs in 2021, far exceeding other financial and personnel challenges. Along with increased costs, nearly half (46%) report declining sales, and more than a quarter (27%) withdrew from cash reserves. (Verizon, 2022)
- More than half of respondents (53%) say their business has experienced operational issues sourcing materials due to supply chain disruptions in the past year. (Verizon, 2022)
- Interest in resources for SMBs is generally highest among respondents in the construction & contracting and food & beverage industries and lowest among those in entertainment & recreation. (Verizon, 2022)
- Nearly 3 in 5 respondents (58%) say they’d find an online network of SMB leaders helpful as they carry their business forward for the rest of the year. (Verizon, 2022)
- Respondents are broadly interested in programs supporting small businesses, particularly free self-paced courses in social media marketing and finance. (Verizon, 2022)
The Role of Small Business Statistics in Strategic Decision-Making
Small business statistics are pivotal in strategic decision-making and help entrepreneurs understand market trends and economic health.
These data-driven insights guide critical decisions related to investment, marketing strategies, and policy formulation. You can recognize the patterns and projections these stats offer to make more informed, future-proof decisions.

![]()
Go to Source
Author: Kiran Shahid